Work Order # 4 – Final Report
Performed by: Ali N. Azadani, PhD @ The DU Cardiovascular Biomechanics Lab at the University of Denver
Sponsored by: Cardiost, Inc.
Date: November 30, 2022
Methods In previous work orders (orders #2 and #3), computational flow simulations were conducted under steady and pulsatile flow conditions in an aortic root model. To create the aortic model, computed tomography (CT) scans of a 23-year-old male were obtained from Vascular Model Repository (VMR). SimVascular was then used for image segmentation, geometry reconstruction, mesh generation, and patient-specific flow simulation and analysis. Venturi devices were placed in the descending aorta in some of the computational models. The idea behind a venturi device is based on the Paradoxical Flow Valve of the Heart (PFVH), described in the United States Patent 7384389, and on the Parallel Narrow Section (PNS), described in United States Provisional Patent P291354US01. In work order #3, a LAUD was modeled virtually by assigning a constant flow rate at the inlet of a conduit connecting the left atrium to the aorta. Figure 1 shows the three different models that were considered in this work order:
1. Control
2. LAUD no Venturi
3. LAUD with Venturi (a throat-to-descending aorta area ratio of 35%)
To create an in-vitro testing platform to examine LAUDs, we decided to 3D print the aortic models already created in SimVascular. We have access to multiple 3D printers at the University of Denver. We chose the U-Print SE Plus 3D printer (Stratasys Ltd., Eden Prairie, MN) for the task. Considering the print volume size of the 3D printer, the CAD models were divided into three parts, so that we could print them one at a time in the printer. We considered flange joints with washers to attach the sections together. The geometry of the flanges and connecting parts were created in 3 Geomagic Design X and SolidWorks (Figure 2). We also added pressure ports to the models which are suitable for the use of strain gauge pressure transducers (Utah Medical Products, Midvale, UT).
The models were 3D printed in the U-Print SE Plus 3D printer and Original Prusa i3 MK3S+ 3D printer (Figure 3). The flanges were connected using four 1/4 in x 1 inch socket head cap screws and nuts (Figure 4).
Compliance and reservoir chambers were built from acrylic at the DU machine shop (Figure 5). All pieces were affixed by appropriate tubing adapters and clamps, ensuring minimal leakage in the flow loop. Flow tests were conducted under steady and pulsatile flow conditions in the aortic roots. A recirculating fluid of 37% by volume glycerin solution (99% glycerin, The Science Company, Denver, CO, USA) in phosphate-buffered normal saline solution (PBS 100 ml tablets, Research Products International, Mount Prospect, IL) was used as a blood analog fluid at room temperature (22º C). For steady flow conditions, a centrifugal pump (Cole-Parmer, GH-72012-10, High-Head Enclosed Motor PP Centrifugal Pump; 4.6 GPM/36.1 ft, 115V) pumped the recirculating fluid to the ascending aorta. For pulsatile flow, a BDC Laboratories PD-1100 pulsatile pump system was used to generate the flow. To replicate the LAUD, a second centrifugal pump (Cole-Parmer, EW-72010-20, Mag Drive PP Centrifugal Pump; 5GPM/11.1 ft,115V) was used in the tests.
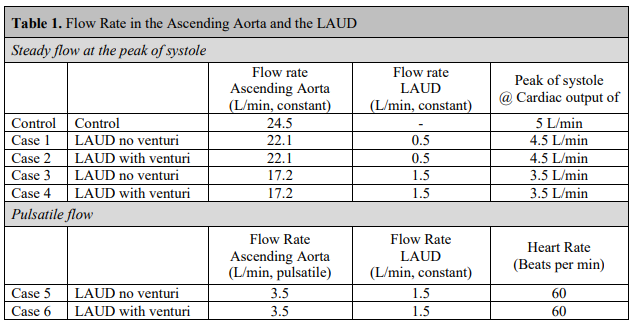
Transonic flowmeters (Transonic Systems, Inc. Ithaca, NY) were used to measure flow rates coming out of the pumps into (i) the ascending aorta and (ii) the conduit. Pressure was measured Figure 4. The flanges were connected using a washer and four screws. 5 at three different locations, namely (i) ascending aorta, (ii) aortic arch, and (iii) descending aorta, using strain gauge pressure transducers (Utah Medical Products, Midvale, UT). Left atrium pressure was kept at a constant pressure level of 10 mm-Hg. The system was run a few minutes before data collection to inspect for any leakage or air within the system. Table 1 shows the conditions considered in the tests. The physiological condition was replicated by controlling local compliance and peripheral resistance.
Results The flow loop consisted of multiple pieces (pumps, valves, chambers, flowmeters, pressure transducers, etc.). All pieces were affixed by appropriate tubing adapters and clamps, ensuring minimal leakage in the flow loop. Figure 6 displays connections of the centrifugal pump (EW72010-20) that replicated the LAUD. A control valve was used to adjust the flow rate, and a transonic flowmeter was used to measure the flow rate. Figure 7 shows the connections attached to the aortic arch. Pressure was measured at the (i) ascending aorta, (ii) aortic arch, and (iii) descending aorta using strain gauge pressure transducers.
Figure 8 displays the flow system built for testing LAUD devices under steady flow conditions. We used four valves to control the flow and adjust the resistance. Valve #1 was between the main pump and the ascending aorta. Valve #2 was between the descending aorta and the reservoir. Valve #3 was between the branches of the aortic root and the reservoir. Valve #4 was used to control the flow of the LAUD (second pump). The flow system was filled with the working fluid and ran for a few minutes to inspect for any leakage or air within the system. The physiological condition of the “Control” case was replicated first using the valves (Figure 8). Valve #1 was kept fully open, and valves #2 and #3 were closed gradually to increase the pressure within the aortic root and read a flow rate of 24.5 L/min for the main pump. Approximately one-third of the flow rate went through the branches of the aortic root in the control case. There was no LAUD in the “Control” case, and Part b (shown in Figure 3) was used in the test. In other cases, Case 1-4 as shown in Table 1, the peripheral resistance (controlled by valves #2 and #3) was kept unchanged. However, valves #1 and #4 were used to adjust the flow rate in the ascending aorta and the LAUD based on the conditions shown in Table 1. For the pulsatile flow condition, the main centrifugal pump was removed, and the root was connected to the BDC pulse duplicator system (Figure 9).
Table 2. shows the pressure magnitude in the ascending aorta, aortic arch, and descending aorta. In the “Control” case, the pressure of the ascending aorta was set at 126.8 mm-Hg (125 mm-Hg < target pressure < 130 mm-Hg). A slight pressure drop was observed in the aortic arch (126.4 mmHg), and then pressure dropped further in the descending aorta (113.9 mm-Hg). In “Case 1”, the LAUD was connected to the descending aorta, but there was no Venturi in the descending aorta. Valve #1 was closed slightly to reduce the flow rate to 22.1 L/min. Valve #4 was also adjusted to have a flow rate of 0.5 L/min in the conduit attached to the Venturi. Pressure in the ascending aorta (123.1 mm-Hg), aortic arch (118.2 mm-Hg), and descending aorta (109.9 mm-Hg) are shown in Table 2. We observed a slight pressure drop in Case 1 compared to the “Control” case. Adding the Venturi in “Case 2” significantly increased the pressure in the ascending aorta (161.4 mm-Hg) and the aortic arch (145.8 mm-Hg). A significant pressure drop was also observed in the descending aorta in “Case 2” (97.6 mm-Hg). In Case 3 and Case 4, the primary pump flow rate was reduced to 17.2 L/min, and the LAUD flow rate was increased to 1.5 L/min. The lower flow rate in the ascending aorta resembled lower pressure in the ascending aorta and aortic arch compared to the control case. Similar to Case 2, in Case 4, adding the Venturi significantly increased the pressure in the ascending aorta and the aortic arch (Table 1). A similar trend was observed under the pulsatile flow condition in “Case 5” and “Case 6” as shown in Table 2.
Discussion We have developed a testing platform to examine LAUD devices. The tests showed that placing a venturi in the descending aorta will increase pressure in the aortic arch. The experimental data presented in Table 2 is in good agreement with the computational data presented in previous work orders. The presence of a Venturi device will alter blood flow hemodynamics (both pressure and flow distributions) in descending aorta and aortic arch branches. The platform can be used to test prototypes that will be designed by the Proof-of-Concept Grant obtained from the Global Business Development division of the Office of Economic Development and International Trade (OEDIT).
Some improvements can be considered in future tests.
Adding more flow sensors (i.e., one to descending aorta and one to the branches) would enable flow measurement at other places in the flow loop.
Using a transport platform would enable flow visualization.
It is recommended to increase the wall thickness of the printed models. We chose a 3-mm thickness. However, removing 3D printer support material caused defects in multiple samples and forced us to print various samples, and some parts failed during the tests.
Adding more pressure ports will help to measure pressure at other locations in the flow system.
It is recommended to place the pressure ports to the pipes rather than to the 3D printed model. 3D printing comes with a tradeoff (feature resolution vs. cost).
Adding compliance chamber to the aortic arch branches and descending aorta could be beneficial.
Computational modeling and simulations are complementary tools that should be considered in the future. As shown previously in previous work orders, a Venturi throat to descending aorta area ratio equal to or more than 50% may reduce the energy consumption of the LAUD in the systole. Device optimization is recommended and will be considered in the OEDIT grant. We have developed a testing platform to examine LAUD devices. Furthermore, animal/clinical studies are required to examine the clinical effects of the LAUD thoroughly.